Reading the Heat: How Infrared Technology and Machine Learning Are Giving Farmers an Early Warning Against Thermal Crop Stress
A corn plant under severe heat stress does not announce its distress through obvious visual signals—not immediately. The physiological damage begins hours before leaves curl or silks desiccate, occurring at the cellular level as enzyme systems falter and pollen viability collapses. By the time a farmer walking a field notices something is wrong, the yield loss is already locked in. For growers across the Central Valley of California, the Southern Plains, and the increasingly volatile growing regions of the mid-Atlantic, that timing gap has become one of the most consequential problems in modern crop management.
The engineering response to this problem is an emerging class of thermal monitoring systems that exploit a well-established physiological principle: a plant under heat or water stress closes its stomata to conserve moisture, reducing the evaporative cooling that keeps leaf tissue temperature below ambient air temperature. An infrared sensor measuring canopy surface temperature can detect this warming—often two to four degrees Celsius above a well-hydrated reference—before any visible symptom develops. The challenge has been building systems that can detect this signal reliably, interpret it correctly, and deliver actionable information to a farmer fast enough to matter.
The Physics of Plant Thermal Signatures
Infrared thermometry in agriculture is not a new concept. Researchers demonstrated the relationship between canopy temperature and crop water status in the 1970s, and handheld infrared thermometers have been available to agronomists for decades. What has changed is the combination of sensor miniaturization, computational power, and connectivity that makes continuous, high-resolution thermal monitoring economically and logistically feasible at the farm scale.
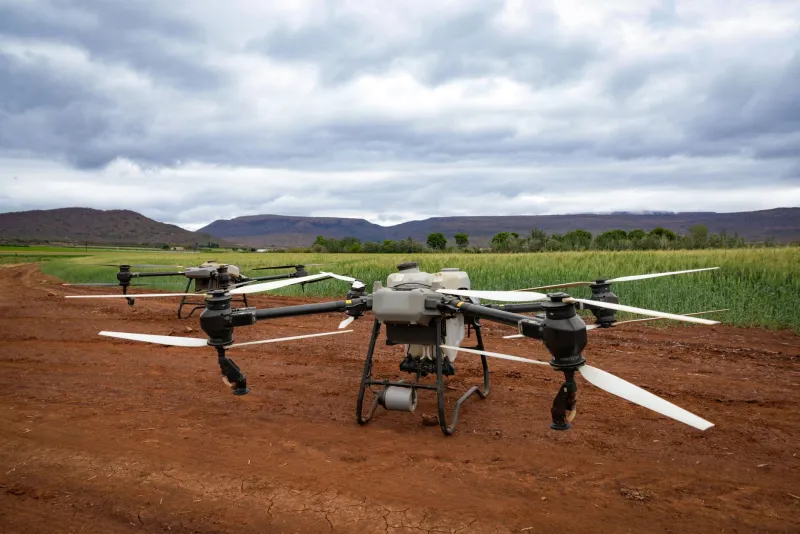
Modern thermal imaging sensors—both microbolometer-based uncooled detectors and the more sensitive cooled variants—can now be mounted on unmanned aerial vehicles, fixed towers, center-pivot irrigation systems, and even tractor-mounted gantries. Each deployment platform offers distinct tradeoffs between spatial resolution, temporal coverage, and cost. A UAV-mounted thermal camera flying at low altitude can resolve individual plant canopies across a field in a single pass, but the data is collected episodically. A tower-mounted sensor provides continuous temporal coverage but captures only a fixed field of view.
The most sophisticated current implementations combine both approaches. Fixed sensors on irrigation infrastructure provide continuous baseline monitoring, flagging anomalies that trigger targeted UAV flights for higher-resolution spatial characterization. This tiered architecture balances the cost of continuous high-resolution imaging against the operational need for timely, spatially detailed information.
Machine Learning Models: Translating Temperature to Action
Raw canopy temperature data is necessary but not sufficient for actionable early warning. A canopy surface reading of 32 degrees Celsius means something very different at 8:00 a.m. under overcast skies than at 2:00 p.m. under full sun on a 105-degree day. Interpreting thermal measurements correctly requires integrating them with ambient air temperature, relative humidity, solar radiation, wind speed, and the crop's developmental stage—a multi-variable problem that is well-suited to machine learning approaches.
Research groups at land-grant universities including Kansas State, UC Davis, and Texas A&M have developed crop water stress index models that normalize canopy temperature against empirically derived baselines for specific crops, growth stages, and atmospheric conditions. Commercial platforms including Arable, CropX, and Hummingbird Technologies are now incorporating these models into operational products, training neural networks on large datasets of paired thermal imagery and yield outcomes to improve the precision of stress detection.
The machine learning challenge in this domain is not primarily one of model architecture but of training data quality and diversity. Heat stress events are, by definition, relatively rare in well-managed fields, creating class imbalance problems in training datasets. Events severe enough to cause measurable yield loss are rarer still. Companies building predictive models must therefore be deliberate about data collection strategies, often partnering with university extension programs and commodity organizations to access historical datasets that span multiple years and geographies.
Some of the most promising recent work applies transfer learning techniques—training base models on large synthetic datasets generated by validated crop simulation models, then fine-tuning on smaller sets of real-world thermal imagery. This approach can substantially reduce the volume of labeled field data required to achieve useful predictive accuracy.
Case Studies: Early Warning in Practice
In California's San Joaquin Valley, where processing tomato and almond growers face increasingly frequent heat domes that can push afternoon temperatures past 110 degrees Fahrenheit, several irrigation districts have begun integrating thermal monitoring into their water delivery scheduling systems. Sensors mounted on center-pivot and drip irrigation infrastructure feed temperature anomaly alerts into farm management platforms, enabling growers to advance nighttime irrigation cycles by several hours in response to predicted daytime heat peaks—a strategy that pre-charges the root zone with moisture before stress conditions develop.
Pilot programs in Kansas winter wheat production have taken a different approach, focusing on the critical grain-fill period when brief heat events above 95 degrees Fahrenheit can reduce kernel weight substantially. Here, thermal monitoring is paired with variety performance databases to provide real-time guidance on whether observed stress levels are within the tolerance range of the planted variety or whether the event represents an anomaly that warrants immediate agronomic attention—adjusting fungicide timing, for instance, to avoid applying materials during peak canopy temperature periods when phytotoxicity risk is elevated.
In the mid-Atlantic, where vegetable production for East Coast markets is increasingly disrupted by late-season heat events, several large growers have deployed fixed thermal sensor networks in combination with automated misting systems. When canopy temperature thresholds are exceeded, the system triggers brief evaporative cooling cycles that reduce leaf surface temperatures by three to five degrees—a margin that, in controlled trials, has demonstrated measurable preservation of fruit set and marketable yield.
The Integration Imperative
The individual components of thermal early-warning systems—infrared sensors, weather stations, machine learning models, alert interfaces—are each technically mature. The engineering frontier lies in their integration: creating systems that ingest data from multiple sensor types, apply validated stress models in near-real-time, and deliver alerts through interfaces that fit naturally into the decision workflows of American farmers.
Connectivity remains a persistent obstacle. Many of the agricultural regions where heat stress risk is highest—the High Plains, the Central Valley, the lower Mississippi Delta—have cellular and broadband infrastructure gaps that complicate real-time data transmission from field sensors to cloud-based analytics platforms. Edge computing architectures, in which processing occurs on the sensor node or a local gateway rather than in a remote data center, are increasingly being designed into commercial products to reduce dependence on continuous connectivity.
As climate projections for the continental United States consistently indicate longer, more intense heat seasons across major production regions, the economic case for investing in thermal monitoring infrastructure strengthens with each growing year. The engineering work now underway—refining sensor accuracy, improving model generalizability, reducing system cost, and hardening connectivity—is building the foundation for a monitoring capability that American agriculture will rely upon with growing urgency in the decades ahead.